Monte Carlo Retirement Planning for Australians

A Monte Carlo retirement simulation estimates the probability your savings and planned withdrawals will survive across thousands of plausible market and inflation paths. Run one now with your actual super balance, planned annual withdrawal, asset allocation, and a realistic planning horizon, or try the Aerowealth demo to see your confidence score in minutes.
Most tools run between 1,000 and 10,000 simulations. Each one plays out a different sequence of returns and inflation. The output is a probability, often called a success or confidence score, that tells you how many of those scenarios ended with money still in the account. That score depends entirely on the assumptions you feed in, which is why understanding the inputs matters as much as reading the result.
Key Takeaways
A Monte Carlo retirement simulation is the most reliable way to test whether your withdrawal strategy survives realistic market sequences, and running it with Australian-specific inputs, including super tax rules, Age Pension interactions, and a 75th-percentile planning horizon, is what separates a useful result from a misleading one.
| Point | Details |
|---|---|
| Run at least 5,000 simulations | Fewer than 1,000 produces unstable percentile estimates; 5,000 is the practical minimum for reliable results. |
| Use the 10th percentile, not the median | Safety-critical decisions like minimum withdrawal floors should be based on near-worst-case paths, not average outcomes. |
| Target a 75th-percentile horizon | The Actuaries Institute recommends planning to roughly age 98 for individuals to avoid understating longevity risk. |
| A 20% annuity allocation can lift confidence | The Challenger case study showed success probability rising from ~81% to ~86% with a CPI-linked annuity allocation across 2,000 scenarios. |
| Aerowealth models Australian rules natively | Aerowealth handles super tax, Age Pension interactions, and side-by-side scenario comparisons for Australian retirement planning. |
Table of Contents
- What a Monte Carlo retirement simulation actually does
- How Monte Carlo works: simulation methods compared
- Key inputs and assumptions you must set before running a simulation
- How to read a Monte Carlo report: success scores, percentiles, and ruin probability
- Where Monte Carlo is most useful in Australian retirement planning
- What Monte Carlo cannot tell you
- How to run a Monte Carlo for an Australian retirement plan
- How to choose a Monte Carlo tool or financial adviser
- Numeric guidance: simulations, horizons, and confidence targets
- Methodological details to confirm before trusting any report
- The Aerowealth Team’s perspective on Monte Carlo in practice
- Aerowealth: Australia’s Monte Carlo retirement planning tool
- Sources
- FAQ
What a Monte Carlo retirement simulation actually does
The name comes from the famous Monaco casino, a nod to the role randomness plays in the method. Instead of projecting one straight-line path using average returns, a Monte Carlo simulation generates thousands of different futures, each with its own sequence of good years, bad years, and everything in between. The result is a distribution of outcomes rather than a single number.
For retirement planning, that distribution answers a question no spreadsheet can: what happens if the market crashes in your first year of retirement? A simple average-return projection ignores that possibility entirely.
Here is a concrete example. That means roughly 750–1,250 of those simulated futures ended in portfolio depletion before year 30. Whether that is acceptable depends on your spending flexibility, your Age Pension entitlement, and how much of your income is non-negotiable.
For Australian retirees, the relevant inputs differ: superannuation tax treatment, Age Pension means-testing, and the specific return and inflation history of Australian asset classes all shift the numbers.
How Monte Carlo works: simulation methods compared
Every Monte Carlo tool generates future return sequences differently. The method matters because it determines how realistic the tail risks look.
Parametric (random-draw): The tool assumes returns follow a normal distribution defined by a mean and standard deviation, then draws randomly from it. Fast and transparent, but it underestimates fat tails, the extreme bad years that actually happen more often than a normal curve predicts.

Historical resampling: Returns are drawn randomly from actual historical data. This preserves the real distribution of outcomes but treats each year as independent, missing the fact that bad years tend to cluster.
Block bootstrapping: Historical returns are sampled in multi-month or multi-year blocks rather than single years. Block bootstrapping preserves volatility clustering, serial correlation, and fat tails, producing more realistic retirement outcome distributions than simple random-draw methods.
Economic scenario generators (multi-factor): These model multiple economic variables simultaneously, including interest rates, inflation, equity returns, and credit spreads, with realistic correlations between them. A multi-factor stochastic economic scenario generator can produce probability distributions for superannuation accumulation and decumulation and is suitable for testing policy and product reforms. The Challenger retirement case study, for instance, uses the Moody’s Analytics Scenario Generator to produce 2,000 adviser-grade scenarios.
Sequencing risk is the reason method choice matters so much. Poor returns early in retirement can permanently reduce a portfolio’s ability to recover, even when average returns over the full period are identical to a luckier sequence. A method that treats each year as independent misses this dynamic entirely.
Pro Tip: For retirement modelling, prefer block bootstrapping or an economic scenario generator over simple parametric methods. They capture the clustering of bad years that actually threatens retirement plans, not just the average volatility.
Key inputs and assumptions you must set before running a simulation
Getting the inputs right is where most people underinvest their time. A plausible-looking set of assumptions can produce wildly different success rates depending on small changes.
Core inputs every tool should ask for:
- Starting balance (your current super balance plus any non-super investments)
- Annual withdrawal amount or percentage (e.g., 4% or A$60,000 p.a.)
- Spending growth assumption, typically CPI or a fixed rate like 2.5–3%
- Asset allocation by class (Australian equities, international equities, fixed income, cash, property) with expected returns and volatility for each
- Correlations between asset classes (often set by the tool; check whether they are realistic)
- Investment fees (platform, fund management, advice) expressed as a percentage
- Tax treatment of withdrawals (super in accumulation vs. pension phase, non-super assets)
- Planning horizon (age at which you want the simulation to end)
- Number of simulations (1,000 minimum; 5,000–10,000 for stable results)
- Rebalancing rules (annual, threshold-based, or none)
Australia-specific notes:
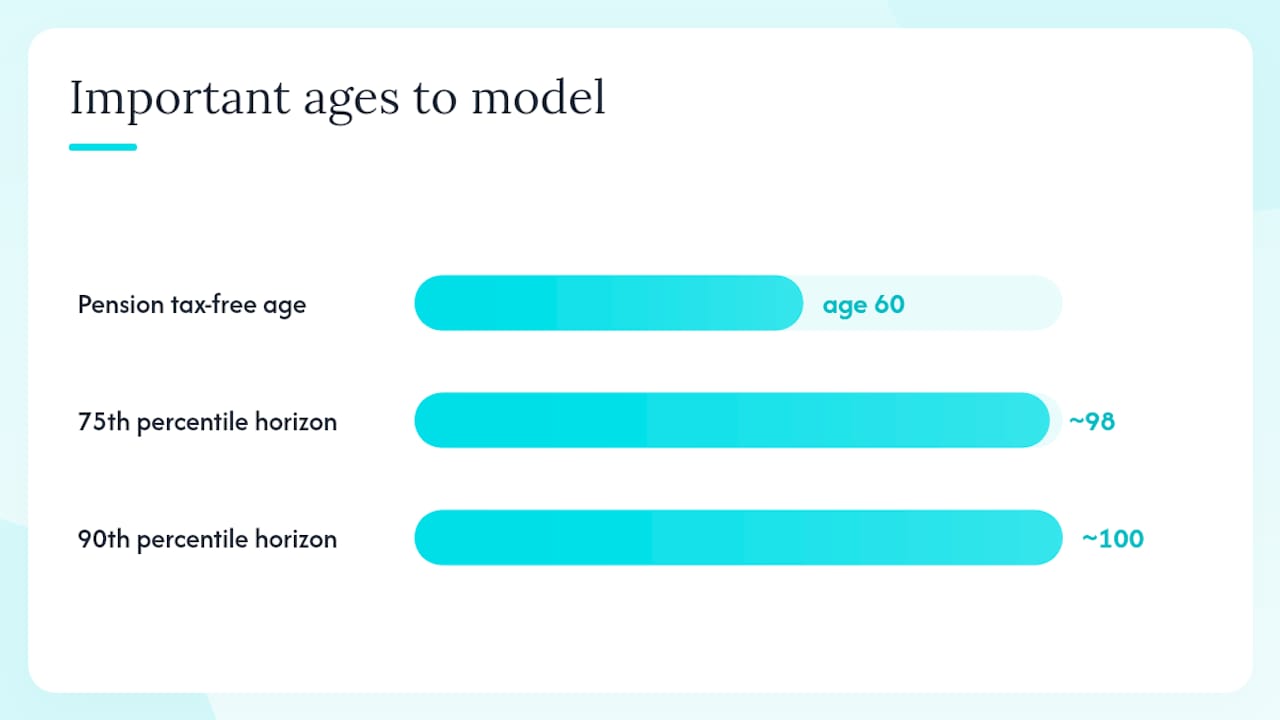
Super withdrawals in pension phase are tax-free for members aged 60 and over, which materially improves after-tax income compared to non-super assets. Age Pension means-testing, both the income test and the assets test, can reduce or eliminate pension entitlement as super balances grow, and this interaction changes the effective success probability of a given withdrawal strategy.
Planning horizons mapped to survival probabilities produce clearer trade-offs between income and longevity risk. A single average life-expectancy horizon understates longevity risk for couples in particular. The Actuaries Institute recommends presenting multiple horizons: 50th percentile (median life expectancy), 75th percentile (roughly age 98 for a 65-year-old), and 90th percentile (roughly age 100 for couples).
Quick checklist to validate any tool’s inputs:
- Can you edit return and volatility assumptions manually?
- Does the tool model fees separately from returns?
- Does it handle Australian super tax rules (accumulation vs. pension phase)?
- Can you set multiple planning horizons?
- Does it show what assumptions were used in the report?
If a tool answers “no” to any of these, treat its outputs with caution. For a deeper look at how Australian retirement account types affect tax modelling, that context is worth reviewing before you set your inputs.
How to read a Monte Carlo report: success scores, percentiles, and ruin probability
The headline number in any Monte Carlo report is the success rate or confidence score: the percentage of simulated scenarios in which the portfolio lasted the full planning horizon.
Key outputs to look for:
- Success/confidence score: The headline probability. Planners commonly target 80–90% depending on client preferences.
- Percentile wealth paths: The 10th, 25th, 50th, 75th, and 90th percentile portfolio balances at each future age. The 10th percentile is the near-worst-case; the 50th is the median.
- Median path: The middle outcome. Useful for planning average scenarios, but not for safety-focused decisions.
- Ruin probability: The complement of the success score. An 85% success rate implies a 15% ruin probability.
- Terminal balance distribution: What the portfolio looks like at the end of the horizon across all scenarios. Relevant for estate planning.
The Challenger case study illustrates how small changes shift these numbers: a baseline success rate of about 81% rose to about 86% after a 20% allocation to a CPI-linked lifetime annuity, tested across 2,000 market scenarios. That 5-percentage-point improvement sounds modest, but it represents roughly 100 fewer failed scenarios out of 2,000.
Pro Tip: Focus on the 10th percentile path, not the median, when making safety-critical decisions like setting a minimum withdrawal floor. The median tells you what happens if you are average-lucky; the 10th percentile tells you what happens if you are not.
Reporting best practice requires the tool to show the number of simulations run, the return-generation method, all key assumptions, and at least one sensitivity run alongside the base case. A report that shows only a single success score with no supporting detail is not trustworthy.
Where Monte Carlo is most useful in Australian retirement planning
Common applications:
- Setting a sustainable withdrawal rate that accounts for your specific asset mix and fees
- Testing different retirement ages to see how each affects your confidence score
- Stress-testing sequencing risk by forcing the worst historical years to occur first
- Evaluating partial annuitisation trade-offs (guaranteed income vs. portfolio flexibility)
- Modelling Age Pension interactions as super balances draw down over time
- Estate and legacy planning by examining terminal balance distributions
For Australian retirees, the Age Pension interaction is often undermodelled. As a super balance declines in later retirement, Age Pension entitlement typically increases under the assets test, effectively providing a floor that improves real-world outcomes beyond what a pure portfolio simulation shows. A well-built tool should model this explicitly.
Mini case study: annuity allocation and confidence
The following figures come from the Challenger practical case study, which tested a retired couple targeting A$100,000 per year in income across 2,000 market scenarios generated by the Moody’s Analytics Scenario Generator.
| Scenario | Annual income target | Scenarios tested | Success probability | Late-life guaranteed income |
|---|---|---|---|---|
| Portfolio only (no annuity) | A$100,000 p.a. | 2,000 | ~81% | None |
| Portfolio + 20% CPI-linked annuity | A$100,000 p.a. | 2,000 | ~86% | CPI-linked for life |
The annuity allocation did not dramatically change the headline number, but it changed the character of the risk. In the scenarios where the portfolio struggled, the annuity continued paying, reducing the severity of the worst outcomes rather than just the probability of failure. For retirees who cannot tolerate the possibility of a large income cut in their 80s, that tail protection matters more than the 5-percentage-point headline improvement suggests.
Monte Carlo modelling also helps address what practitioners call the “fear of running out” (FORO). Detailed scenario analysis can shift retiree behavior toward more confident spending when the modelling shows a robust floor, reducing the common pattern of chronic underspending in early retirement.
What Monte Carlo cannot tell you
Monte Carlo is a model. Every model has limits, and retirement models have several worth naming explicitly.
Hard limits:
- Results are only as good as the assumptions. Optimistic return assumptions or underestimated fees produce misleadingly high success scores.
- The model cannot predict your actual behavior. A plan with an 85% success rate assumes you stick to the withdrawal strategy in every scenario, including the ones where your portfolio drops 40% in year two.
- Policy shocks are not modelled. Changes to super tax treatment, Age Pension eligibility rules, or means-testing thresholds can materially alter outcomes in ways no simulation captures.
- Spending is rarely constant. Healthcare costs tend to rise in later retirement; lifestyle spending often falls. A flat real-withdrawal assumption misrepresents how most retirees actually spend.
Behavioral caveats:
- Panic selling during a simulated bad sequence is not modelled. In practice, many retirees reduce equity exposure after a market fall, locking in losses and missing the recovery.
- Misreading probability as guarantee is common. An 85% success rate is not a promise; it means roughly 1 in 7 simulated paths failed.
- Anchoring to the median path leads to overconfidence. The median is the outcome if everything goes roughly as expected. Planning only to the median ignores the scenarios where it does not.
Common tool pitfalls:
- Opaque or fixed assumptions that cannot be edited
- Too few simulations (fewer than 1,000 produces unstable results)
- Unrealistically high return assumptions that inflate success scores
- Fees or taxes not modelled, making the portfolio appear larger than it will be
- No sensitivity testing, so fragility is invisible
How to run a Monte Carlo for an Australian retirement plan
Here is a practical walkthrough you can follow in any capable tool, with Aerowealth-specific notes where relevant.
- Gather your inputs. Current super balance, any non-super savings, planned annual withdrawal (or target income), current asset allocation, and your planned retirement age.
- Set your planning horizon. Use at least two: your median life expectancy and a longer horizon at the 75th or 90th survival percentile. For a 65-year-old Australian, that typically means running to age 90 and age 98.
- Choose your simulation count. Set to at least 1,000; 5,000 produces more stable percentile estimates. Aerowealth’s engine handles this automatically.
- Select your return-generation method. Prefer block bootstrapping or a scenario generator over simple parametric if the tool offers it.
- Run the base case. Record the success score, the 10th percentile path, and the median terminal balance.
- Run sensitivity tests. At minimum, run three: returns 1% lower than base, inflation 1% higher than base, and a worst-10-years-first sequence. These three sensitivity runs reveal how fragile your plan is to plausible adverse conditions.
- Document your assumptions. Write down every input you used. When you re-run in 12 months, you need to know what changed.
- Iterate. If the 10th percentile path shows depletion before age 85, adjust: lower the withdrawal, shift the allocation, or model a partial annuity.
Example scenario for an Australian retiree:
- Starting super balance: A$800,000
- Annual withdrawal: A$50,000 (6.25% initial rate)
- Asset allocation: 60% growth / 40% defensive
- Inflation assumption: 2.5% p.a.
- Fees: 0.8% p.a.
- Planning horizon: age 65 to age 95 (30 years)
- Simulations: 5,000
Running the worst-10-years-first sensitivity test will likely drop that score by 5–10 percentage points, revealing the true sequencing exposure.
In Aerowealth, open the scenario comparison panel after the base run and add a second scenario with the sensitivity inputs. The side-by-side view shows immediately where the two paths diverge and at what age the gap becomes critical. For those planning to retire before the superannuation preservation age, the transition to retirement modelling feature handles the bridge-year period separately.
A simulation built on last year’s balance and last year’s market assumptions is not your current plan.
How to choose a Monte Carlo tool or financial adviser
Feature checklist for any tool:
- Editable return, volatility, and inflation assumptions (not locked defaults)
- Transparent scenario-generation method (parametric, bootstrap, or scenario generator)
- Control over the number of simulations
- Percentile reporting (not just a headline success score)
- Australian super tax modelling (accumulation vs. pension phase, concessional contributions)
- Sensitivity testing built in or easy to run manually
- Age Pension interaction modelling
Adviser credentials to look for:
- Certified Financial Planner (CFP) designation or equivalent
- Actuary or actuarial associate for complex longevity modelling
- Documented methodology: the adviser should be able to show you the assumptions used and explain the scenario-generation method
- Experience with Australian superannuation rules, not just generic retirement planning
When to escalate to professional advice:
Complex situations benefit from adviser-grade modelling. These include business sale proceeds entering super, defined-benefit scheme interactions, large capital gains tax events, or any scenario where the Monte Carlo output implies a major lifestyle trade-off. A tool gives you the framework; an adviser with documented methodology gives you the defensible plan.
Aerowealth is built specifically for Australian users, with super tax rules, Age Pension interactions, and CPI-linked annuity modelling built into the engine. For most individuals doing their own planning, it covers the feature checklist above without requiring a spreadsheet or a separate adviser tool. For a broader view of retirement income strategies that complement Monte Carlo outputs, that context is worth pairing with your simulation results.
Numeric guidance: simulations, horizons, and confidence targets
Simulation count:
- 1,000 simulations: minimum for a stable headline score
- 5,000 simulations: recommended for reliable percentile estimates
- 10,000 simulations: useful when testing tail probabilities or comparing closely spaced scenarios
Planning horizons:
- 50th percentile (median life expectancy): roughly age 87–89 for a 65-year-old Australian
- 75th percentile: roughly age 98, recommended by the Actuaries Institute as the standard planning horizon for individuals
- 90th percentile: roughly age 100, appropriate for couples where at least one partner surviving to very late age is a real possibility
Confidence target bands:
- Conservative (90%+): appropriate when spending is largely non-discretionary and there is limited flexibility to reduce withdrawals
- Balanced (80–90%): the range most planners target for clients with moderate spending flexibility
- Growth-oriented (70–80%): acceptable only when there is a meaningful income floor (Age Pension, annuity, or part-time work) that covers essential expenses regardless of portfolio performance
Higher confidence targets require lower withdrawal rates or larger starting balances.
Sensitivity runs to always include:
If any of these drops your success score below your target band, your base plan is fragile, not just conservative.*
Methodological details to confirm before trusting any report
Before acting on a Monte Carlo result, verify these items in the tool or report:
- Number of simulations: Stated explicitly. Fewer than 1,000 produces unstable results; the number should be visible in the output.
- Random seed or repeatability: Can you re-run and get the same result? Reproducibility is a basic quality check.
- Return-generation method: Parametric, historical resampling, block bootstrap, or scenario generator. Each has different tail-risk properties.
- Fee treatment: Are investment fees, platform fees, and advice fees deducted from returns before the simulation runs? If not, success scores are overstated.
- Tax treatment: Does the tool apply Australian super tax rules (0% on pension-phase earnings, 15% on accumulation-phase earnings)? Ignoring this understates after-tax income.
- Rebalancing rules: Does the portfolio rebalance annually, at thresholds, or never? Rebalancing affects both return and volatility assumptions.
- Mortality assumptions: Does the tool use a fixed horizon or a survival-probability-weighted horizon? Fixed horizons understate longevity risk.
- Percentile reporting: Is the full distribution shown, or only the headline score? A tool that shows only the success rate hides the shape of the risk.
Each of these items affects comparability across tools. Two tools can produce different success scores for identical inputs if they differ on any of these dimensions.
The Aerowealth Team’s perspective on Monte Carlo in practice
Monte Carlo is the right framework for retirement planning. That is not a controversial position. What is underappreciated is how much the quality of the result depends on inputs that most people set carelessly or accept as defaults.
The two inputs that move success scores most dramatically in Australian plans are the planning horizon and the fee assumption. Most people underestimate how long they need to plan for, and most tools default to fee assumptions that are lower than what Australians actually pay across platform, fund, and advice costs combined.
The behavioral dimension also gets less attention than it deserves. A simulation assumes you hold your allocation through every bad sequence. The model cannot account for what you will actually do. That is not a reason to distrust Monte Carlo; it is a reason to build a plan with enough margin that a behavioral mistake does not become catastrophic.
The Aerowealth approach defaults to 5,000 simulations, a 75th-percentile planning horizon, and three built-in sensitivity runs: lower returns, higher inflation, and worst-sequence-first. Those defaults were chosen because they reflect the Actuaries Institute guidance on longevity and the practitioner consensus on sensitivity testing. They are not conservative for the sake of it. They are the settings that produce results you can actually rely on.
Aerowealth: Australia’s Monte Carlo retirement planning tool
Most retirement planning tools were built for generic markets and retrofitted for Australia. Aerowealth was built the other way around, starting with Australian superannuation rules, Age Pension means-testing, and the tax treatment of pension-phase withdrawals.

The platform models super balances, investment property, ETFs, and mortgages in a single plan. Side-by-side scenario comparisons let you test “retire at 60 vs. retire at 63” or “annuity vs. no annuity” without rebuilding your inputs from scratch. Sensitivity tests run in one click. The AI assistant explains what any output means under Australian rules, in plain language.
The free plan covers the core simulation; the Pro subscription adds bridge-year modelling for early retirement before the super preservation age, advanced mortgage offset strategies, and a higher AI assistant quota.
See your retirement confidence score or review the plan options to find the right fit for your situation.
This article is general information, not a substitute for advice from a qualified financial advisor. Consult a qualified financial professional about your own circumstances before acting on anything here.
Sources
- Using a stochastic economic scenario generator to analyse uncertain superannuation and retirement outcomes — Annals of Actuarial Science
- Improving confidence and portfolio outcomes — a practical case study — Challenger
- The Longevity Conversation — Actuaries Institute
- What a trip to Monte Carlo can teach you about having a more secure retirement — Morningstar Australia
FAQ
What is the Monte Carlo method for retirement planning?
A Monte Carlo retirement simulation runs thousands of randomized future market and inflation scenarios to estimate the probability your savings and withdrawals will last the full planning horizon. The output is a success or confidence score, typically expressed as a percentage.
What is a good Monte Carlo success rate for retirement?
How does changing the withdrawal rate affect Monte Carlo results?
Higher withdrawal rates reduce success scores, often sharply.
How long will A$500,000 last using a 4% withdrawal rule?
Whether that lasts 30 years depends heavily on asset allocation, fees, and sequencing. A Monte Carlo simulation across 5,000 scenarios will show the range of outcomes; the result is not a single answer but a probability distribution.
Does Aerowealth model Australian superannuation in its Monte Carlo simulations?
Yes.